-
Why vaccination strategy is not as simple as it seems
September 14, 2021
When vaccination just started getting underway in the U.S., many people were confused and angered at the fact that many localities were pursuing vaccination strategies that didn’t just boil down to vaccinating the most vulnerable. On the other hand, there was a significant movement to vaccinate front-line workers which often cited equity and racial justice as motivations. What didn’t seem to make the news as often is the mathematics that make this a reasonable alternative to consider.
-
The case against "herd immunity" through infection
December 21, 2020
As COVID-19 cases continue to spike and governments implement stronger and stronger restrictions, I thought it might be worth visiting an argument that I have encountered on and off over the past year. In its most basic form, the argument goes “why not simply let the pandemic run its course while protecting the vulnerable as best we can, but not worrying overly much (indeed, perhaps even encouraging) those young and healthy individuals to contract the virus in a push toward herd immunity?”
-
Interpreting graphs: the red-blue coronavirus divide
June 28, 2020
I recently saw this graph floating about the internet, and it has some interesting properties that I thought might warrant a new type of post, where I dive into interpreting a particular figure and see where it takes me.
-
Comparing COVID-19 Responses
May 4, 2020
There has been a lot of talk about different countries’ responses to the ongoing COVID-19 pandemic, but how can we tell which responses are better than others? Even if one country has fewer cases/deaths/etc. than another, does that mean their approach is transferable?
-
Resources for Tracking the COVID-19 Epidemic
April 9, 2020
this post was inspired by this recent blogpost
It is easy to succumb to number overload when faced with the incredible volume of data available detailing the spread of the SARS-CoV-2 virus around the globe. As of the writing of this post, more than 1.5 million individuals have been confirmed to have contracted COVID-19 and nearly 90 thousand individuals have died. As the pandemic has progressed, dozens of dashboardsand even tutorials on how to make your own have been created to track the climbing numbers each day. With so many to choose from, how does one pick a trustworthy source? and what are the most important numbers to consider anyway?
-
Rethinking poster sessions? (Post associated with EEID 2019)
June 7, 2019
Get the full paper pre-print here (pdf) or read online on AUTHOREA.Edit (7 June 2022) – The paper is now officially out (and open access)!
I confess, I am not a huge fan of posters.
I find them to be inefficient in their production, ineffective in their communication, and awkward for both presenter and viewer during poster sessions themselves. In part because of this, before this week, I hadn’t made a poster since undergrad. In spite of my prejudice, I tried to dive into the task, telling myself it was a valuable skill to condense information into a single infographic. Yet, I found myself struggling with the same issue I have expounded on before with regards to presentations: namely there is a two-use-case problem. On one hand, you want something aesthetic that compliments (without distracting from) the more important part—what you are saying—but on the other hand, you want this to have some shelf-life and be useful to viewers after you are no longer physically standing in front of them.
-
5 Tips for Early Career ESA Attendees
August 20, 2018
When I first went to the annual meeting of the Ecological Society of America (ESA), I was overwhelmed. The conference is huge by the standards of most ecological conferences, boasting around 3000 ecologists in attendance each year. It stretches on for five and a half days with dozens of concurrent sessions, hundreds of posters, and mixers most evenings.
As a newcomer, especially if you are not traveling with someone who is both social and conference savvy, this can make for a lonely experience which is only amplified by the swirling masses of people around you. It is tempting to disengage, to either pack your schedule with talks or to give up and just spend some time seeing the city in which the conference is hosted that particular yearNot that you shouldn’t make some time for that too!.
-
ESA2016 & HTML presentations
August 19, 2016
Welcome to the site!
Last week, I attended the 101st Annual Meeting of the Ecological Society of America in Ft. Lauderdale, FL. While there I was able to meet up with several colleagues I hadn’t seen in a long time and see many interesting talks. I also gave a talk of my own, where I presented some recently submitted work on distinguishing ecological categorizations or roles (e.g. parasites vs predators) using a purely statistical consideration of the network structure. For this, we utilized (and enhanced) the group model which was introduced to Ecology by my adviser (Stefano Allesina) and committee member (Mercedes Pascual) back in 2009.
I am a recently graduated Ph.D. student from the department of Ecology & Evolution at the University of Chicago. Working in Stefano Allesina's lab, I was exposed to the powerful perspective of seeing the complexity of nature as a network of connected pieces. I have been particularly captivated by the interaction between the dynamics of ecological systems (i.e. the stability and feasibility of equilibria and the role of transient dynamics) and the structures (both local and global) found in network representations of those systems.
Though I have worked historically with ecological interaction networks, many of my projects exploit the extreme generality of mathematical models, and have applied network- and matrix-based methods to a host of systems. I am driven by the development of computational and statistical methods to enhance our ability to detect patterns in ecological data.
More recently, I have been moving more into the study of how diseases spread on networks, working as a postdoc with Meggan Craft on a variety of projects applying this network perspective to disease ecology and, more recently, the spread of COVID-19 in realistic human contact networks. I also work with Linda Kinkel, keeping my more ecological roots alive by looking at the relationship between the structures of microbial interaction networks, including those detailing resource niche overlap and direct antimicrobial competition in plant microbiomes.

Disease dynamics
Disease dynamics have long been modelled through the use of compartmental models which rely on an assumption of well-mixing. That is, the case where all individuals have an equal likelihood of infection at any given timepoint. But we know that this is not reflective of reality, where individuals are connected in complex social networks that dictate the paths of pathogens through a population. I am interested in the ways the structure of these social networks dictates the spread of disease, limiting or exacerbating epidemics.
Stability

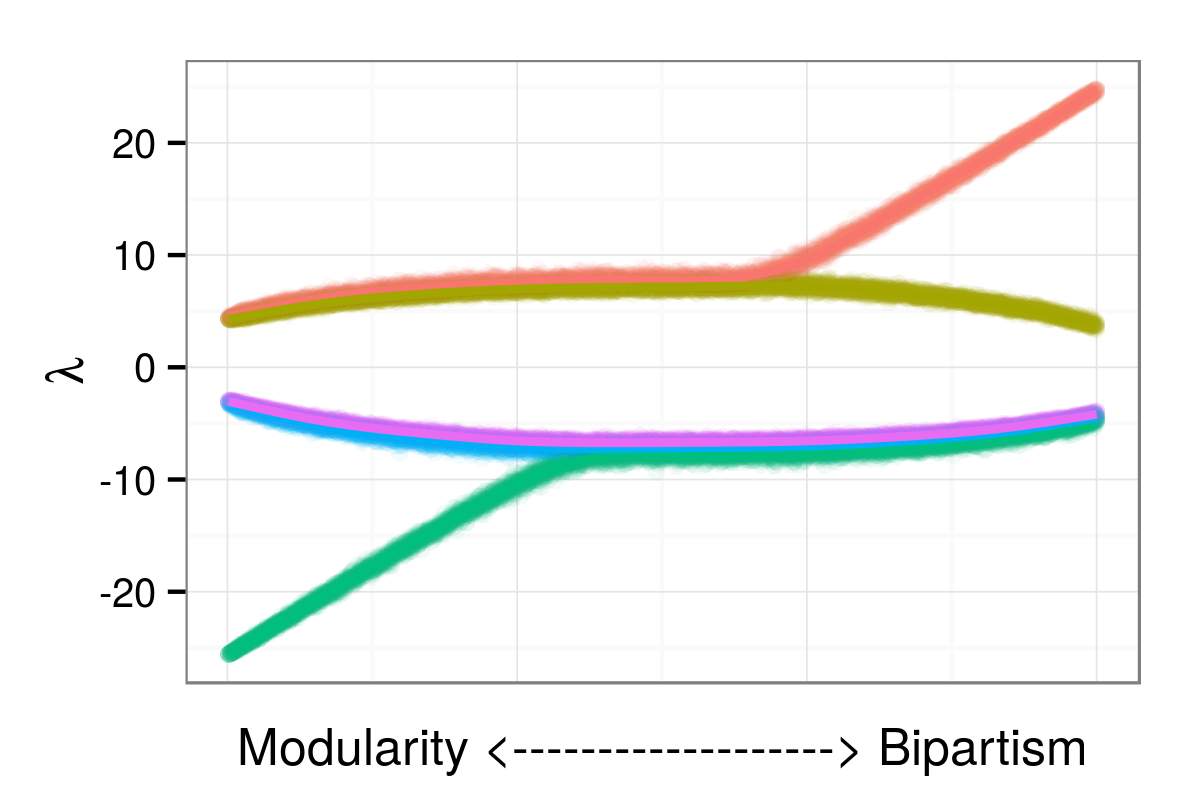
More than 40 years ago, Robert May introduced random matrices to ecology in a famous demonstration of the relationship between complexity and stability which was counter to the prevailing view of the time (May 1972). Following a long hiatus, random matrices have recently re-emerged as the impetus behind several important advances in our understanding of complex ecological systems, spearheaded by Si Tang and Stefano Allesina (Allesina & Tang 2012; Tang & Allesina 2014; Tang, Pawar, & Allesina 2014). I am particularly interested in applying random matrix techniques to bipartite networks (i.e. networks for which the nodes can be divided into groups such that all links are between nodes of disparate groups).
Structure

Random matrices à la May look for patterns in matrix ensembles which randomize matrix elements. Advances since then have explored alternative modes of randomization (Tang, Pawar, & Allesina 2014), yet these still tend to focus on node degree and interaction strength correlation. An alternative form of randomization would be to preserve small network structures such as motifs or global network structures such as nestedness and modularity. I am interested in applying this technique to evaluate the importance and utility of small structures which are found at unexpected densities in empirical networks.
Science of Science

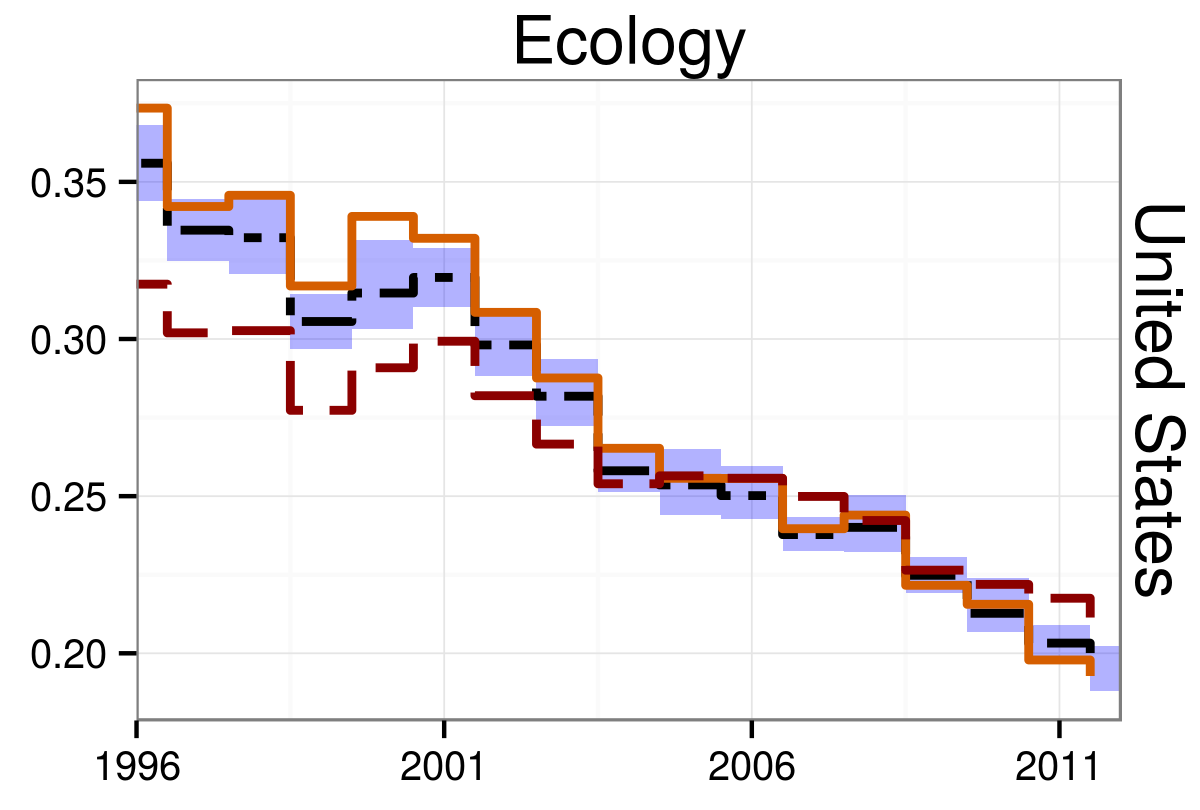
In addition to my central focus on ecology, I have also been interested in studying the process of doing science, especially aspects related to publication and evaluating performance. For instance, one project I have worked on looked at the influence of multinational affiliation lists on the success of publications. We confirmed a historical result that more countries improves both the quality of journal a paper is published into and the number of citations (compared to peer publications) it receives once published. Furthermore, we showed that the benefit differs according to which countries are in the affiliations -- some collaborations show much greater improvements than others and some actually decrease the expected number of citations!
, , , , ; 2024
, , , , , , , , , , ; 2024
, , , , , , , ; 2024
, , , , , , , , , , , , , ; 2024
, , , ; 2023
, , , , ; 2023
, , , , ; 2023
, , , , , , , , ; 2022
, , , , ; 2022
, , , , ; 2021
, , , , , , , ; 2021
, , , , , , , , , , ; 2020
, , , , , , , , , , , , , , , , , , , , , , , , , , , , , ; 2019
, , ; 2016
-
109th Annual Meeting of the Ecological Society of America
Subinhibitory concentrations of antibiotics differentially alter microbial resource-competition network structure in Streptomyces from NPK amended and control soils
August 8, 2024
-
DBC Seminar Series Talk
Consequences of an interconnected world for disease dynamics
February 9, 2024
-
MIDAS Network Annual Meeting
Understanding the LINCS in realistic human contact networks
April 30, 2021
-
Quantitative Epidemiology (EpiQ) Seminar Series
Multi-strain disease dynamics on metapopulation networks
September 23, 2019
-
104th Annual Meeting of the Ecological Society of America
Characterizing resource-competition network structure within the endophytic microbiome
August 14, 2019
-
103rd Annual Meeting of the Ecological Society of America
A naïve approach to a longstanding question: Using ordination to identify gradients in ecological data
August 6, 2018
-
University of Chicago Department of Ecology & Evolution Dissertation Defense
Structural Inferences: three cases of linking pattern & process in ecological networks
May 2, 2018
-
2017 International School and Conference on Network Science
Higher-order interactions stabilize dynamics in competetive network models
June 20, 2017
-
101st Annual Meeting of the Ecological Society of America
Identifying unique species roles by characterizing differences in ecological network structure
August 9, 2016
-
University of Chicago GAANN Retreat
Learning from success & failure: Using graph spectra to identify differences in network structure
April 24, 2016
-
100th Annual Meeting of the Ecological Society of America
Looking locally to see globally: motif sampling to distinguish interaction type and predict dynamical properties of whole networks
August 12, 2015
-
American Chemical Society International Center™ Webinar Series
Global Scientific Collaboration: Key to Scientific Success
February 25, 2015